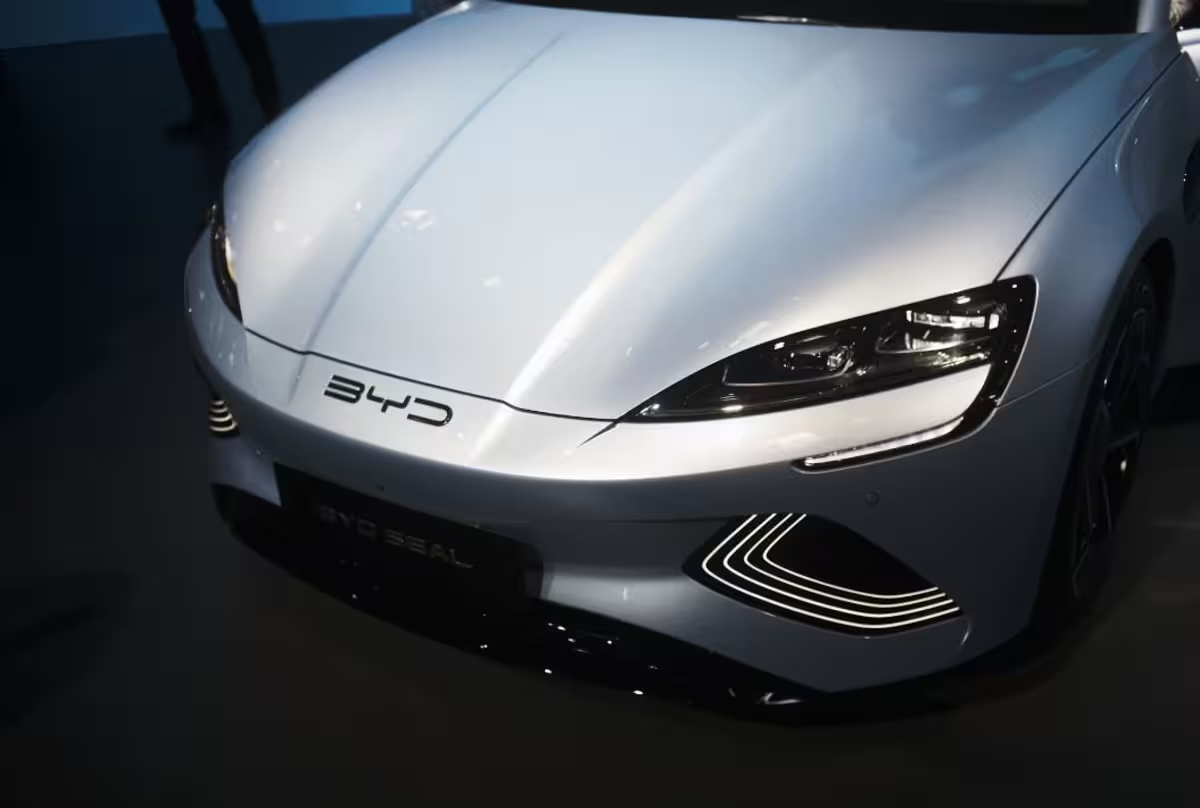
Which Car Company Is Most Sustainable? BMW vs Tesla vs Mercedes
Which car company is the most sustainable? There is no defensible single winner unless every company is measured over the same vehicle lifetime, electricity mix, production boundary and material scope. BMW currently offers the strongest product-level transparency of these three through independently verified vehicle footprints. Tesla has the clearest zero-tailpipe product portfolio, while Mercedes-Benz publishes concrete circular-material and production targets. Those are different strengths, not one league table.
Automotive sustainability starts with the measurement boundary
A car can look clean under one boundary and poor under another. Tailpipe emissions cover only fuel burned by the vehicle. Factory metrics cover company-owned plants. A lifecycle assessment adds raw materials, suppliers, logistics, vehicle use, maintenance and end-of-life treatment. Comparing Tesla's tailpipe figure with BMW's factory water use or Mercedes-Benz's recycled-material target produces a ranking, but not knowledge.
This review compares BMW, Mercedes-Benz and Tesla by the quality and meaning of their public evidence. It does not convert incompatible company reports into a fake score. The central question is more useful: what does each manufacturer measure well, what remains outside the boundary, and what would a buyer or engineer need for a fair vehicle-to-vehicle comparison?
The five boundaries people confuse
| Boundary | What it includes | What it can hide |
|---|---|---|
| Tailpipe | Fuel burned while driving | Electricity generation, fuel production and manufacturing |
| Vehicle use | Energy consumed over a stated distance and grid or fuel pathway | Production and end of life |
| Factory | Energy, water, waste and direct emissions at owned sites | Purchased cells, steel, aluminium and electronics |
| Supply chain | Purchased materials, components and logistics | Use-phase assumptions and recycling credits |
| Full lifecycle | Materials through production, use and end of life | Different lifetime, mileage, grid and allocation assumptions |
The last row is the right ambition, but even lifecycle studies need identical assumptions. A heavy performance SUV driven 200,000 km on a low-carbon grid cannot be compared fairly with a compact car driven 100,000 km on a coal-heavy grid without showing both scenarios. The same boundary discipline matters when comparing battery EVs with hydrogen vehicles, where fuel production can dominate the result.
BMW: strongest vehicle-level disclosure, with mixed operational results
BMW's most valuable move is not a slogan. It publishes a Vehicle Footprint for specific products, including lifecycle CO2e, circularity, efficiency and supply-chain information, with carbon-footprint verification by TÜV. A model-level document is more useful than a group average because it lets a buyer see the consequences of one battery, body and powertrain.
The 2025 BMW Group Report also exposes results that do not all move in the same direction. Potable-water withdrawal fell to 1.62 m3 per vehicle, while 4.91 million m3 of water was recycled or reused. Material recovery covered 93.8% of production waste. At the same time, waste sent for disposal per vehicle rose 10.1% year on year to 1.85 kg. Publishing the setback alongside the progress makes the report more credible, not less.
Mercedes-Benz: a concrete circular-material direction
Mercedes-Benz's 2025 annual report places circularity inside the product and production strategy rather than treating recycling as a disposal problem. Its stated ambition is to raise the share of secondary raw materials in the passenger-car fleet to 40% by 2030. The report also separates waste targets for cars and vans and describes work to return end-of-life material to vehicle components.
The number still needs a denominator. "Secondary material" can be measured across different material groups, products and accounting boundaries, and a future target is not current performance. The useful question is whether the company later reports actual mass by material, model and quality level. Recycled aluminium that meets a structural specification is a stronger circularity result than mixed material recovered only for a lower-grade use.
Tesla: zero tailpipe emissions are real, but not a lifecycle result
Every Tesla passenger vehicle is battery-electric, so it emits no CO2 or exhaust pollutants at the tailpipe. That is a clear product advantage in cities and removes combustion emissions from the use phase. It does not make vehicle operation emission-free. Charging still has a grid footprint, and the battery, body, electronics and factory create emissions before delivery.
Tesla's Impact Report addresses avoided emissions, manufacturing, energy products and battery-material recovery. Its fleet scale also creates a large future stream of packs for recycling. A fair comparison still needs matching model-level lifecycle documents, common grid scenarios and the same mileage. A corporate avoided-emissions total cannot be compared directly with another company's water per vehicle or recycled-content percentage.

Recyclable, recycled and circular are different claims
Recyclable means a material could be recovered under a defined process. Recycled content means secondary material is already in the new product. Recovered at end of life means a real vehicle entered a collection and treatment system. Closed loop means the material returned to an equivalent application rather than being downcycled. A high recyclability percentage does not prove that the material will be collected or used in another car.
Batteries make the distinction visible. A pack may be repaired, reused in stationary storage, dismantled for modules, or recycled directly. The best route depends on state of health, chemistry, safety, transport and demand for second-life systems. Our guides to EV battery lifespan, the battery manufacturing market and solid-state batteries cover those engineering constraints.
How to compare two cars honestly
- Use the same functional unit. Compare one passenger-kilometre or one vehicle over the same lifetime distance, not one car against one company.
- Match vehicle class. Battery size, mass, performance and usable space change both production and use-phase impact.
- Run several electricity scenarios. The same EV has a different use-phase footprint on coal-heavy, average and renewable grids.
- Show the material boundary. Cells, aluminium, steel, electronics and replacement parts must not disappear into an unspecified supplier total.
- State end-of-life assumptions. Recycling credits should reflect a plausible collection and recovery route, not theoretical recyclability.
The comparison also belongs inside the automotive product-development process. Material targets enter requirements, supplier evidence is controlled through APQP and PPAP, and the production launch must prove the actual process, not a prototype claim. The systems that make a car work remain the functional baseline.
BMW vs Mercedes vs Tesla: the EV-Global verdict
No absolute winner. BMW currently gives the strongest model-level evidence of the three through independently verified Vehicle Footprints and a detailed group report that includes negative movement as well as progress. Tesla has the cleanest tailpipe proposition because its passenger fleet is fully electric. Mercedes-Benz has a concrete circular-material direction and extensive sustainability reporting. Calling any one of those "the most sustainable car company" would require assumptions that the public data do not support.
The higher bar is straightforward: publish model-level lifecycle footprints using common scenarios, report actual secondary-material mass, separate targets from results, and keep prior years visible when methods change. That would let readers compare products rather than corporate narratives.
Primary sources, checked July 24, 2026: the audited sustainability statements in the BMW Group Report 2025 and Mercedes-Benz Annual Report 2025; BMW's model-specific iX3 Vehicle Footprint; and Tesla's 2025 Impact Report. Company methods and boundaries differ, so figures are not treated as a single score.
EVs and sustainability: frequently asked questions
Are electric cars really better for the environment?
Usually over a comparable full lifecycle, but the result depends on vehicle size, battery production, lifetime mileage and charging electricity. A valid comparison must state those assumptions.
Which carmakers are the most sustainable?
No common dataset supports one winner. BMW currently offers strong model-level footprint disclosure, Tesla a fully electric passenger-car portfolio, and Mercedes a concrete circular-material target.
What happens to old EV batteries?
Depending on health and economics, packs may be repaired, reused, repurposed or recycled. Not every pack receives a second life; safe transport, chemistry and demand determine the route.
What is the difference between zero tailpipe and zero lifecycle emissions?
Zero tailpipe emissions means the vehicle emits no exhaust while driving. Lifecycle emissions also include materials, manufacturing, electricity or fuel production, maintenance and end-of-life treatment.