WLTP vs EPA vs CLTC: Why the Same Electric Car Has Three Range Figures, How to Convert Them, and What You Will Actually Get
Why does the same electric car have three different range figures? Because three governments drive it through three different lab cycles. China's CLTC averages 29 km/h and never exceeds 114 km/h, Europe's WLTP averages 46.5 km/h and peaks at 131 km/h, and the US EPA label takes a two-cycle result and multiplies it by 0.7. For 2025 and 2026 cars the ratios are fairly stable: EPA is about 0.85 times WLTP, WLTP about 0.82 times CLTC, so EPA is about 0.70 times CLTC. None of the three runs the heater or holds 120 km/h, so on a real motorway expect about EPA x 0.85, WLTP x 0.72 or CLTC x 0.6, and take off another 25 to 30% in a -7°C winter.
Tesla sells one Model 3 Long Range rear-wheel drive. In China it is rated at 830 km, in Europe at 750 km, in the United States at 363 miles, which is 584 km. Same 78.4 kWh LG pack, same motor, same body. The 246 km between the first number and the last are not a measurement error, and no engineer in Fremont or Shanghai changed anything. They are three governments' opinions about how you drive, written into three test cycles, plus one correction factor that only Washington applies. Once you know what each cycle assumes, the numbers stop contradicting each other, and a Porsche beating its label at 70 mph while a Tesla misses it stops being a mystery.
What each test actually does
WLTP: 30 minutes, 23 kilometres, no heater
The Worldwide Harmonised Light Vehicles Test Procedure, mandatory in the EU for new types since September 2017 and for all new cars since September 2018, drives the car on a chassis dynamometer through four phases, low, medium, high and extra high, for 1,800 seconds and 23.25 km. The average speed is 46.5 km/h including 13% of the time stopped, the peak is 131.3 km/h for a few seconds in the last phase, the lab is at 23°C, the heating and air conditioning are off, and the dyno simulates drag and rolling resistance on a flat road. For a battery car the lab runs cycles plus constant 100 km/h segments from a full pack until the car can no longer follow the trace, measures the usable energy, divides by the consumption in the dynamic parts, and that is the combined range. No factor is applied afterwards. The one discretion a manufacturer gets is the interpolation family: a type approval covers the lightest, lowest-drag version and the heaviest, draggiest one, and every wheel and equipment combination in between gets its own figure, which is why a Volkswagen ID.4 Pro is "512 to 574 km" and Hyundai quotes consumption spans for the same motor. Japan uses WLTP without the extra-high phase.
EPA: two cycles, then multiply by 0.7
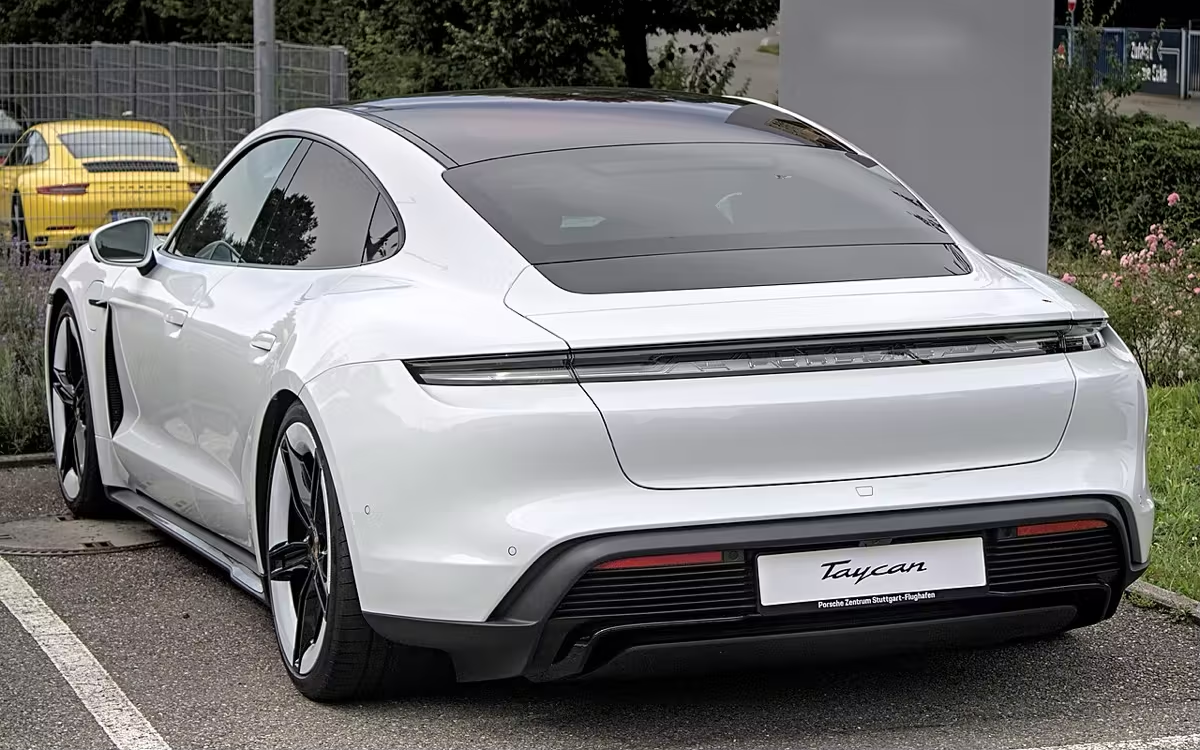
The US label comes from SAE J1634's multi-cycle test: city cycles (UDDS, 21.2 mph average, 23 stops) and highway cycles (HWFET, 48.3 mph average, no stops) run alternately from a full pack to depletion, with constant-speed segments between them to shorten the day. The rule that matters is 40 CFR 600.210-12. A label must be "five-cycle" or adjusted to be equivalent, and the easy route, which almost everyone takes, is to "multiply 2-cycle fuel economy values and driving range by 0.7". The alternative is to run the full five-cycle set, which adds a -7°C test, an 80 mph aggressive cycle and a 35°C air-conditioning cycle, and derive the car's own factor; Tesla is widely understood to use that route, and a factor of about 0.72 appears on EPA's own 2025 sample label. Two more clauses shape the numbers. From model year 2024 a car without a single default drive mode is tested in its best and worst modes and averaged, which is why Tesla cut the Model Y Long Range AWD from 330 to 310 miles and the Model S Plaid from 396 to 359 in January 2024 without touching the cars. And a manufacturer "may voluntarily lower the value for electric driving range". Porsche did exactly that: the EPA data file for the 2020 Taycan Turbo S carries the note "Combined range voluntarily lowered from 200 miles", and the label said 192. The label shows one combined figure weighted 55% city and 45% highway; the EPA also computes a highway range, and does not print it. For the 2026 Jeep Recon that hidden highway figure is about 196 miles against a label of 222.
CLTC: a Chinese commute, idling for a fifth of the time
The China Light-duty vehicle Test Cycle comes from GB/T 38146.1-2019 and was built from driving data of about 3,800 vehicles in some 40 cities. The passenger version runs 1,800 seconds and 14.48 km at an average of 28.96 km/h, spends 22% of the time idling, peaks briefly at 114 km/h and has no motorway phase at all. Battery cars in China report range under CLTC (a few still quote NEDC), while combustion cars are type-approved on WLTC; every new EV launch quotes CLTC because it produces the biggest number. The standard's own development vehicle shows the hierarchy: 509 km on CLTC, 484 on NEDC, 398 on WLTP, 390 on EPA. A low-temperature test at about -7°C with the heater on exists in the standard as an optional annex, and nobody prints it. What did change in 2026 is a mandatory consumption limit: GB 36980.1-2025, in force since 1 January, sets a maximum kWh per 100 km for each battery car by curb mass on the CLTC, roughly 8 to 11% tighter than the old voluntary values, and ties it to the purchase-tax exemption.
NEDC, for the figures still floating around
The New European Driving Cycle was four identical 1970s urban loops and one extra-urban run: 10.93 km, 33 km/h average, 120 km/h touched once at the end. It produced EV ranges 15 to 20% above WLTP, it left EU type approval in 2018, and Xpeng was still quoting an NEDC figure in 2025. If a brochure says NEDC, multiply by about 0.85 to get a WLTP equivalent.
| What differs | WLTP | EPA label | CLTC |
|---|---|---|---|
| Average speed | 46.5 km/h over 23.25 km | City cycle 34 km/h (21.2 mph), highway cycle 78 km/h (48.3 mph), weighted 55/45 | 29 km/h over 14.5 km |
| Peak speed | 131 km/h | About 97 km/h (60 mph); 80 mph only in the optional five-cycle test | 114 km/h, reached briefly |
| Time stopped | 13% | About 18% in the city cycle (23 stops), none on the highway cycle | 22% |
| Temperature | 23°C | 20 to 30°C for the two-cycle test; -7°C and 35°C only in the five-cycle test | 23°C |
| Heating and air conditioning | Off | Off (on only in the optional SC03 cycle) | Off |
| Correction after the test | None | Multiplied by 0.7, or by a derived five-cycle factor | None |
| Manufacturer discretion | A span by wheel and equipment (interpolation family) | May "voluntarily lower" the figure | None documented |
The conversion factors, with the evidence
Rules of thumb on the internet disagree with each other, from "EPA is 11% below WLTP" to "15 to 25% below", because they were derived from different cars in different years; in 2020 some Teslas even had EPA figures above their WLTP ones. The only honest way to get a factor is to take cars sold in both markets today and divide. Here are fifteen of them, EPA figures from the 2026 fueleconomy.gov database and the 2025 database where no 2026 entry exists yet.
| Car | EPA range | WLTP range, km | EPA / WLTP |
|---|---|---|---|
| Tesla Model 3 Premium RWD (the former Long Range) | 363 mi (584 km) | 750 (18 in) | 0.78 |
| Tesla Model Y Premium AWD | 327 mi (526 km) | 600 | 0.88 |
| Hyundai Ioniq 5 Long Range RWD | 318 mi (512 km) | 570 | 0.90 |
| Hyundai Ioniq 6 Long Range RWD, 18 in | 342 mi (550 km) | 614 | 0.90 |
| Kia EV6 Long Range RWD | 319 mi (513 km) | 582 | 0.88 |
| BMW i4 eDrive40, 18 in | 333 mi (536 km) | 590 | 0.91 |
| Mercedes CLA 250+ with EQ Technology | 374 mi (602 km) | 709 (test car; up to 792 claimed) | 0.85 |
| Mercedes EQE 320+ sedan | 308 mi (496 km) | 639 to 693 | 0.72 to 0.78 |
| Porsche Taycan RWD Performance Battery Plus (2025) | 318 mi (512 km) | 592 to 634 (up to 678 claimed) | 0.75 to 0.86 |
| Porsche Macan 4 Electric, 20 in | 324 mi (521 km) | 613 | 0.85 |
| Porsche Macan Turbo Electric | 293 mi (471 km) | 591 | 0.80 |
| Polestar 4 Long Range Single Motor | 310 mi (499 km) | 620 | 0.80 |
| Volkswagen ID.4 Pro RWD | 291 mi (468 km) | 512 to 574 | 0.82 to 0.91 |
| Ford Mustang Mach-E Premium ER RWD | 320 mi (515 km) | 600 | 0.86 |
| Lucid Air Grand Touring, 19 in | 512 mi (824 km) | 960 | 0.86 |
The spread is 0.72 to 0.91 and the median sits at 0.85, so the working rule is EPA = WLTP x 0.85, plus or minus 0.07. The spread is not random. Hyundai, Kia and BMW sit at 0.88 to 0.91, which means their WLTP figures are relatively conservative or their US figures relatively generous; Tesla's long-range car, Polestar, the Porsche Taycan and the Mercedes EQE sit at 0.72 to 0.80, which means big European numbers that shrink the most on the US label. The road tests below show which of those labels survive contact with a motorway.
CLTC is more uniform, because every car in the sample is measured in the same Chinese labs and nobody applies a factor.
| Car | CLTC | WLTP | WLTP / CLTC | EPA |
|---|---|---|---|---|
| Tesla Model 3 Long Range RWD | 830 | 750 | 0.90 | 584 |
| Tesla Model 3 Long Range AWD | 753 | 629 | 0.84 | 557 |
| BYD Seal 82.5 kWh RWD | 700 | 570 | 0.81 | n/a |
| BYD Atto 3 60.5 kWh | 510 | 420 | 0.82 | n/a |
| BYD Dolphin 60.5 kWh | 520 | 427 | 0.82 | n/a |
| Nio ET5 100 kWh | 740 | 580 | 0.78 | n/a |
| MG4 64 kWh, 18 in | 520 | 435 | 0.84 | n/a |
| Zeekr 001 100 kWh RWD | 750 | 620 | 0.83 | n/a |
| Polestar 2 Long Range Single Motor | 780 | 654 | 0.84 | 505 |
| CLTC development sample vehicle | 509 | 398 | 0.78 | 390 |
The spread is 0.78 to 0.90 with a median of 0.82, so WLTP = CLTC x 0.82, which is exactly the factor the converter sites use, and EPA = CLTC x 0.70. Tesla is the outlier at 0.90 only because its WLTP figures are themselves generous. For a car that exists only with a CLTC figure, which is most of what Xiaomi and the other Chinese newcomers sell, the planning version is harsher: multiply by about 0.72 for mixed mild-weather driving and by about 0.6 for a 120 km/h motorway. A Chinese road test of the SU7 reached 643 km against an 800 to 810 km rating in gentle conditions, right on 0.8.
What the road says: motorway, winter, summer
Three kinds of independent test exist: steady motorway speed, winter and summer. At a steady 75 mph, Car and Driver found across more than 350 combustion cars that they beat their labels by 4% on average, while EVs fell 12.5% short of theirs; its testing director blamed the 55% city weighting, cycles that reward regeneration, and the inconsistent choice between the two-cycle and five-cycle routes. Consumer Reports' 2023 run of 22 EVs at 70 mph had nearly half falling short, the Ford F-150 Lightning by 50 miles, while the BMW iX, BMW i4 and Mercedes EQE 350 each beat their labels by more than 40 miles. InsideEVs' rolling 70 mph tests tell the same story car by car, and the 2024 to 2026 results are in the chart.
The two Porsches and the Bolt beat their labels at motorway speed; the Tesla, the Nissan (tested at 3°C, which costs a few points on its own) and the Rivian miss by 17 to 23%. That is the brand pattern in one picture: a conservative label is a feature, and a boxy body is a tax that the city-weighted test hides.
Winter is where the labels break entirely. Norway's El Prix test in January 2026 drove 24 cars from Oslo into -32°C and measured an average loss of 38% against WLTP: the MG S6 EV and Hyundai Inster lost 29%, the Kia EV4 34%, the Tesla Model Y 40% (600 to 359 km), the Mercedes CLA 41% (709 to 421), and the Lucid Air 46% (960 to 520 km, still the longest distance of the day). The same organisers' summer test in June 2026, 24 cars at 12 to 18°C, had the field within a few percent of WLTP on average, with a BMW iX3 50 going 781 km against a 770 km rating. Telemetry agrees: Recurrent's 30,000 US cars retained 78% of their mild-weather range at 0°C and 70% at -7°C, AAA's 2026 dynamometer work found a 39% loss at -7°C with the cabin at 22°C and 8.5% at 35°C, and Geotab's 5 million trips put peak range at 115% of rated at 21.5°C. The ADAC, which drives WLTC plus a motorway section at 23°C with 200 kg aboard and the air conditioning on, and counts the electricity from the wall rather than from the battery, finds consumption 14 to 26% above the WLTP figure for most 2026 cars (Mercedes CLA 350: 14.8 against 12.7 kWh/100 km; BMW iX3 50: 18.3 against 15.4) and 34 to 41% above for the worst (Kia EV5, Renault Twingo). Strip out the 10 to 15% that AC charging loses between the wall and the battery and the cars themselves use roughly 5 to 12% more than their WLTP figure on ADAC's mild mixed loop; the rest is a cost, paid at the wall, that never shows up as range. Our guide to why EVs lose range in winter covers the physics; the short version is that cabin heat, battery heating, denser air and a cold pack that refuses regeneration all arrive together.
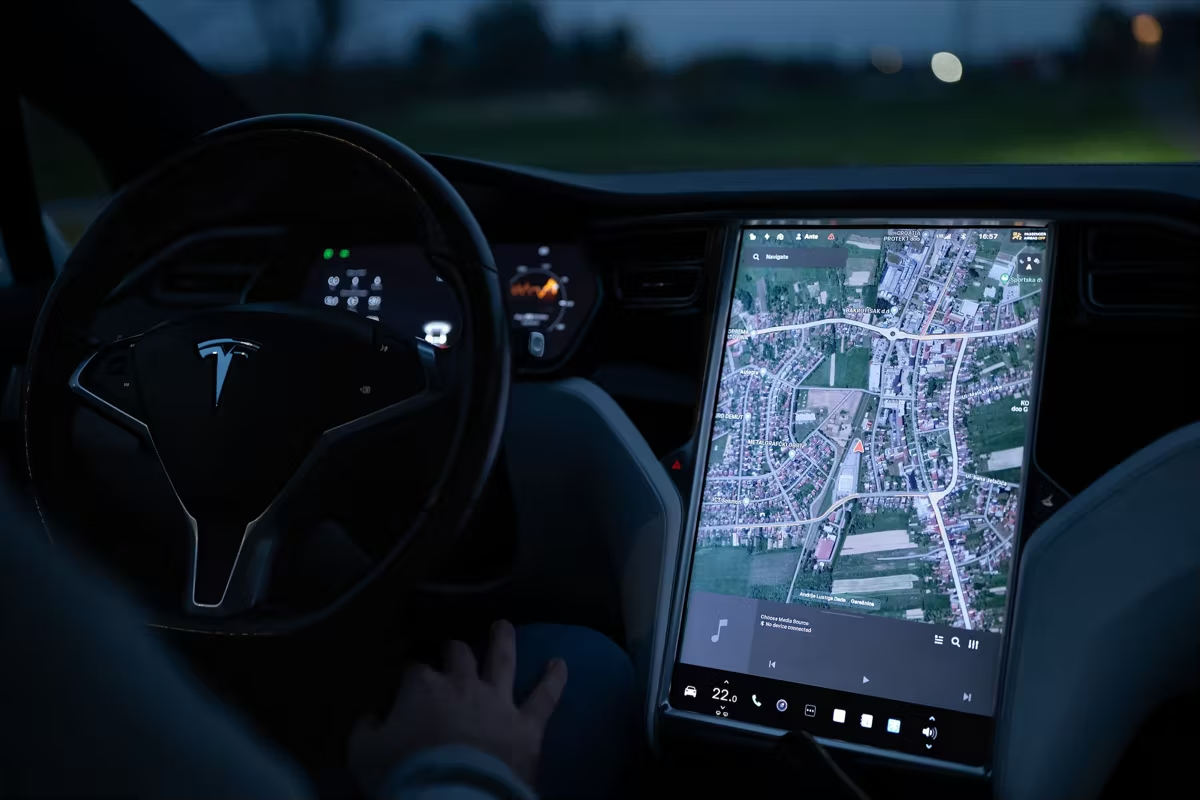
The number on the screen is a lab result with a government factor applied. The road, the speed and the thermometer decide what you actually get. Photo: Vladimir Srajber / Pexels.
Who rates conservatively, and who does not
Line the lab ratios up against the road tests and the brands sort themselves. Porsche lowered its own Taycan label in 2020, its 2020 to 2023 Taycans beat the EPA figure by 17 to 37% at 70 mph, and a 2025 Taycan 4 Cross Turismo on winter tyres still did 302 miles against 277; the Macan Electric runs the same way. Mercedes' EQS beat its label by 13% at 70 mph and the CLA by 16% on Edmunds' mixed loop. BMW's iX and i4 sit 5 to 7% above at 70 mph and the iX3 beat WLTP in Norway. Lucid's Air delivered 410 miles at 75 mph, exactly its unprinted EPA highway figure. On the other side, Tesla's Model 3, Y and S have missed their labels by 10 to 13% at 70 mph since 2019, the 2026 Model Y Standard by 16.5%, and the Model S managed 78% of its figure at 75 mph; Tesla's optimism is a highway-speed phenomenon, because the same cars beat their labels on city-weighted loops. Hyundai and Kia, honest on WLTP, miss the EPA figure by 11% at 70 mph and by 24% on 20-inch wheels. And every pickup and boxy SUV pays for its drag at a steady speed, which the city-weighted test hides: F-150 Lightning -16%, Rivian R1T -19%, the Rivian R2 -23% in its first 70 mph run, Jeep Recon -28% at 75 mph.
The mechanism is the same in every case: the cycles are slow, warm and full of regeneration, so a steady 120 km/h motorway in January is outside every official test, and the cars whose labels survive it are the ones whose makers chose, or were forced by physics, to be modest.
Speed, wheels, temperature, roof boxes: the multipliers that matter
Speed is the big one, because drag rises with the square of it. Bjørn Nyland's paired runs at 90 and 120 km/h, a 33% increase in speed, raised consumption by 40 to 49% and cut range by 29 to 33%: a Model Y Performance went from 510 to 361 km, a Kia EV6 from 445 to 298. Auto motor und sport measured 100 against 130 km/h and got a BMW iX from 533 to 383 km and a Polestar 2 from 404 to 291, both up 39% in consumption. A 2027 Chevrolet Bolt lost 10% of its range going from 70 to 80 mph. Between 100 and 130 km/h, each extra 10 km/h costs about 8 to 12% of range; an Audi Q6 e-tron at a GPS 200 km/h on the Autobahn used about 53 kWh/100 km and would have covered roughly 168 km from full.
Wheels are the one nobody checks. The same car on the same cycle: Hyundai Ioniq 6 on 18-inch wheels 342 miles, on 20-inch 291, a 15% cut; Lucid Air Grand Touring 512 miles on 19-inch all-seasons, 480 on 20s, 446 on 21s; BMW i4 M60 278 on 19s and 232 on 20s, a 17% drop for a single inch because the tyre changes too; Nissan Leaf 303 on 18-inch steel wheels, 288 on alloys and 259 on 19s; Tesla Model 3 Long Range 750 km WLTP on 18s and 691 on 19s. One inch usually costs 5 to 8%, two inches, all-terrain rubber or a performance tyre 10 to 17%, and the configurator rarely says so. Roof boxes are worse than most people expect: auto motor und sport's 130 km/h runs put an empty box at 16 to 22% more consumption and a box plus two bikes on a rear carrier at 28 to 43%, which took the iX from 383 to 300 km and the Polestar 2 from 291 to 203.
| Situation | From an EPA figure | From a WLTP figure | From a CLTC figure |
|---|---|---|---|
| Mixed driving, 15 to 25°C | x 1.0 | x 0.85 to 1.0 | x 0.72 |
| Steady 113 km/h (70 mph), mild | x 0.85 to 0.9 for sedans and crossovers; x 0.75 to 0.8 for pickups and boxy SUVs | x 0.72 to 0.78 | x 0.60 to 0.65 |
| Steady 120 km/h (75 mph), mild | x 0.875 on average; x 0.7 to 0.75 for trucks | x 0.70 to 0.75 | x 0.58 to 0.62 |
| Winter around 0°C, mixed roads | x 0.78 | x 0.80 | x 0.65 |
| Winter at -7°C, cabin heated | x 0.61 to 0.70 | x 0.60 to 0.65 | x 0.50 to 0.55 |
| Deep cold, -20 to -32°C, highway | about x 0.55 | x 0.62 (worst cars x 0.54) | x 0.50 |
| Hot, 35°C with air conditioning | x 0.9 | x 0.80 | x 0.68 |
Put together, the formula for a motorway trip in mild weather is EPA x 0.85, WLTP x 0.72 or CLTC x 0.6, and in a -7°C winter another quarter to a third comes off. Our real-world range guide works that through for the cars Europeans actually buy, and the state of the charging network decides whether the shortfall matters.
Free toolEV range calculatorEnter your car's rating, then set speed, temperature and load. It applies the multipliers from this article and tells you what the road will give you.What changes in 2026 and 2027
Europe is adding the one number everybody asks for. Commission Implementing Regulation (EU) 2026/1764, published on 22 July 2026, writes an electric range at low temperature, the -7°C "Type 6" procedure from UN Regulation 154, into EU type approval with the Euro 7 dates: new types from 29 November 2026, all new cars from 29 November 2027. Whether that figure reaches the showroom label is not settled in the text; for now it is measured and available to the authorities. Euro 7 itself, Regulation (EU) 2024/1257, requires the battery to keep at least 80% of its certified energy to five years or 100,000 km and 72% to eight years or 160,000 km, requires a state-of-health monitor whose reading is available to the owner, and creates an environmental vehicle passport. Real-world electricity consumption from on-board monitoring, which already shows petrol cars using 21% more fuel than their WLTP figure and plug-in hybrids three times more, will not cover battery cars until 2030. The chemistry you choose and how fast the car charges will matter more to a winter trip than any of this.
The United States changed nothing that affects the label. The EPA's final rule of 18 February 2026 repealed the vehicle greenhouse-gas standards and explicitly left fuel-economy testing and labelling untouched, so the multi-cycle test, the 0.7 factor, the five-cycle option and the right to lower a figure voluntarily all stand, and 2027 models are being certified under them. China tightened the consumption side rather than the range side: the mandatory kWh per 100 km limits from January 2026, and, for the 2026 to 2027 purchase-tax exemption, a minimum of 100 km of electric range for plug-in hybrids and range-extender EVs, up from 43 km.
The EV-Global verdict
Trust the EPA figure most and the CLTC figure least, and trust none of them for a motorway in winter. For a trip at 120 km/h in mild weather, multiply EPA by 0.85, WLTP by 0.72 and CLTC by 0.6; at -7°C take off another quarter to a third. Treat a Porsche, Mercedes, BMW or Lucid EPA rating as a floor and a Tesla, Hyundai-Kia or pickup rating as a ceiling, check which wheels the rating was measured on, and remember that the 55% city weighting is a policy choice that makes every American label look better in traffic than on the interstate. The single most useful reform would cost nothing: print the highway range the EPA already calculates, and print the -7°C range Europe is about to measure. Until then, the range calculator above and our ranking of the best EVs, which uses tested rather than rated figures, are the nearest thing to the truth.
Range ratings: frequently asked questions
What is the difference between WLTP and EPA range?
They come from different lab cycles and different rules. WLTP drives 23.25 km at an average of 46.5 km/h with a 131 km/h peak and applies no correction; the EPA runs city and highway cycles, weights them 55/45 and multiplies the result by 0.7 (or by a car-specific five-cycle factor). For 2025 and 2026 cars the EPA figure is about 0.85 times the WLTP figure, with a spread of 0.72 to 0.91 by brand.
How do I convert WLTP range to EPA range?
Multiply WLTP by 0.85 for a typical car. Use 0.88 to 0.91 for Hyundai, Kia and BMW, whose WLTP figures are conservative, and 0.72 to 0.80 for Polestar, the Porsche Taycan, the Mercedes EQE and Tesla's long-range models, whose WLTP figures are generous. To go from CLTC to WLTP multiply by 0.82, and from CLTC to EPA by 0.70.
Is WLTP range realistic?
In mild weather and mixed driving, roughly: Norway's summer 2026 test had 24 cars within a few percent of WLTP on average, and the ADAC measures consumption 14 to 26% above WLTP once charging losses are counted. On a motorway at 120 km/h expect about 72% of the WLTP figure, and in a -7 to -32°C winter the 2026 El Prix test measured 62% on average and 54% for the worst cars.
What is CLTC range and why is it so high?
CLTC is China's test cycle, 14.5 km at an average of 29 km/h with 22% of the time idling, a brief 114 km/h peak, no motorway phase, 23°C and no heating. Low speeds and frequent stops suit an electric drivetrain, so the figure is about 22% above WLTP and 43% above EPA for the same car. For real planning multiply a CLTC figure by about 0.72 in mild mixed driving and by 0.6 on a motorway.
Which is more accurate, EPA or WLTP?
EPA is closer to the road for most cars because of the 0.7 factor, but at a steady 75 mph EVs still fall 12.5% short of their EPA label on average, and some brands differ from the rule by 20 points in either direction. Porsche, Mercedes, BMW and Lucid tend to beat their EPA figures at motorway speed; Tesla, Hyundai-Kia and most pickups miss them. A tested figure at your speed and temperature beats either label.
Does WLTP range include heating, and what happens in winter?
No. WLTP, EPA and CLTC are all measured at about 23°C with the heating and air conditioning off. In winter, telemetry from 30,000 US cars shows about 78% of mild-weather range at 0°C and 70% at -7°C, AAA measured a 39% loss at -7°C with the cabin heated, and the Norwegian El Prix test of January 2026 averaged 38% below WLTP between -7 and -32°C. From 29 November 2026 the EU measures a -7°C range at type approval for new models.
Hero photo: Cedé Joey / Pexels. Interior photo: Vladimir Srajber / Pexels. Both resized and converted to AVIF. Data from 40 CFR 600.116-12 and 600.210-12, Regulation (EU) 2024/1257 and Implementing Regulation (EU) 2026/1764, GB/T 38146.1-2019 and GB 36980.1-2025, fueleconomy.gov (2025 and 2026 databases), manufacturer WLTP figures, InsideEVs and Out of Spec 70 mph tests (2020 to 2026), Car and Driver (SAE 2023-01-0349), Consumer Reports (December 2023), NAF/Motor El Prix (January and June 2026), ADAC (November 2026), Recurrent (November 2025), AAA (May 2026), Geotab, Bjørn Nyland and auto motor und sport.